Gene Expression Data Analysis Suite (GEDAS)
Checks view
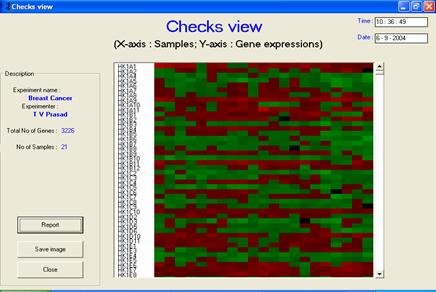
· Description or interpretation: The dendrograph view (or checks view, as called in the GEDAS software), is very similar to the dendrogram output generated by TreeView software or other graph visualization software. It has been introduced in the GEDAS software as it can be used for visual inspection of raw, preprocessed and clustered data, refer following figure. This representation alone is not a true dendrogram output as it does not accompany the gene tree and array tree, and hence, named as dendrograph.
· Complexity: Similar to textual representation
· Special considerations/features: The user can be given control to select, though not provided in GEDAS, the colour of representing low to high gene expression such as green to red or blue to red or so on. Different colour codes can be assigned to represent null values or zero values. Shades represent the intensity or magnitude of expression. In the above example, green colour represents the positive expression values of gene, red coloured blocks represent negative values and black coloured blocks represent zero values. In this, each cluster is separated by horizontal white line.
· Advantages and drawbacks: It is the most effective form of visualizing behaviour trend of gene expression in many samples and many genes in one shot. However, if the dataset is very large, it also requires another GUI support to extract the gene names mined out. It is very helpful for studying the trend in time series data and data of same parameter over different samples.
· Applicability: It can be applied to all clustering/classification techniques including SOM, LVQ, k-means and SVM. Through GEDAS, this has also been extended to HC and PCA.
|
|
|
|
|
Figure:
The checks view (or dendrograph view) visualization is a well-known method of
plotting the gene expression levels through colour coded boxes. It gives
a fair idea of gene expression and can be applied to time series as well as
discrete data. It has been applied to raw, preprocessed and clustered
data |