Gene Expression Data Analysis Suite (GEDAS)
Eigen graph
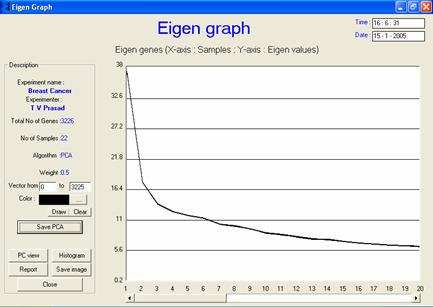
· Description or interpretation: The Eigen view is a line graph drawn as the sum of principal component (Eigen value) and individual expression value. This graph is drawn on the basis of the Eigen values of the each sample (if PCA is applied on sample) or gene (if PCA is applied on sample). The graph is very similar to the conventional line graph, see following figure. Though, all the components are displayed in the graph, the first two or three principal components play important role in dimensionality reduction. The following diagram shows the Eigen graph of PCA applied on genes of breast cancer data.
· Complexity: Same as PC view.
· Special considerations/features: A good Eigen graph always falls down exponentially. Facility to change the colours of principal components has been provided in the GEDAS software. The graph can be redrawn with required number of principal components.
· Advantages and drawbacks: Note that the first two or three principal components are usually sufficient to generate the entire dataset. All remaining components give a crowded look, which means that the distances between them is very negligible and hence, can be eliminated.
|
|
|
|
|
Figure: The Eigen graph is in no way
different from a line graph. Each Eigen line is the sum of principal
component and individual gene expression value. |