Gene Expression Data Analysis Suite (GEDAS)
Histogram
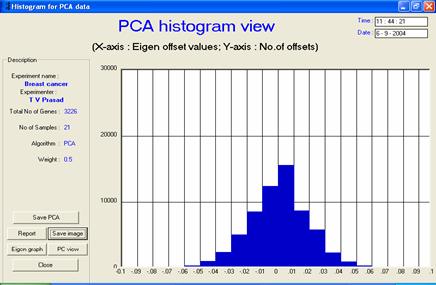
· Description or interpretation: Histogram is most popular visualization technique in array data mining, and can be applied to visualization of gene expression data also. This representation is useful in giving a comparative/quantitative/qualitative visualization of the parameters and is used in the visualization of raw data and pre-processed data. In a specific case, it has been applied to PCA also, e.g., the following figure shows the histogram of PCA applied on the breast cancer data.
· Complexity: A histogram can be generated in O(n2)
· Special considerations/features: A line connecting the mid point of the bars could be generated to represent line graph.
· Advantages and drawbacks: Histogram is very primitive and provides limited statistical information compared to other techniques
|
|
|
|
|
Figure: The histogram is the most fundamental
visualization of gene expression data and can be applied to all forms of
datasets |