Gene Expression Data Analysis Suite (GEDAS)
Microarray view
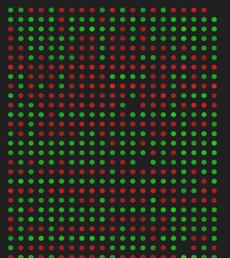
· Description or interpretation: The microarray view is very similar to the dendrograph view (or checks view), except that the individual genes are represented in circular spots. In this visualization each cluster is separated by horizontal white line. It has been introduced in the GEDAS software so that it can be used for visual inspection of raw, preprocessed and clustered data.
· Complexity: Similar to the dendrograph representation
· Special considerations/features: The user can be given control to select the colour of representing low to high gene expression such as green to red or blue to red or so on. Different colour codes can be assigned to represent null values or zero values. Shades represent the intensity or magnitude of expression.
· Advantages and drawbacks: It is another effective form of visualizing behaviour trend of gene expression in many samples and many genes in one shot, Figure 4.12. However, if the dataset is very large, it also requires another GUI support to extract the gene names mined out. It is very helpful for studying the trend in time series data and data of same parameter over different samples.
· Applicability: Through GEDAS, this has been applied to SOM, LVQ, k-means, HC, SVM and PCA.
|
|
|
|
|
Figure:
The microarray view is very similar to the dendrograph or checks view, except
that the individual genes are represented in circular spots. It is a good
visualization for having visual inspection of gene expression data |