Gene Expression Data Analysis Suite (GEDAS)
PC view or scatter graph
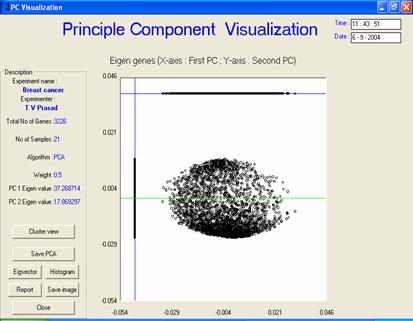
· Description or interpretation: The representation is an improved version of scatter plot meant for PCA. All the data points are plotted along PC1 vs. PC2 first, which gives a scatter plot view. Thereafter, all these data points are projected onto two arbitrary straight lines (one horizontal and other vertical) representing principal components which give an idea of clusters formed. Since only two or three principal component would be sufficient to generate the entire dataset, unlike the general scatter plots, this representation for the PCA usually contains display of two principal components, one vertical and other horizontal, see following figure. All the data points are projected on these two lines, which helps in bifurcation of data into two clusters obtained from PCA.
· Complexity: The visualization generates output in the order of O(n) as it is a linear representation/plotting of data points. This is because the number of dimensions would be two or three after processing as compared to the number of samples (or dimensions) in the raw form.
· Special considerations/features: A good PCA scatter graph should always be elliptical in shape.
·
Advantages and drawbacks: The output is processed for the second time
to project the data points on the principal components.
|
|
|
|
|
Figure: The principal component view
is essentially a scatter graph in a way that the space of the genes/samples
plotted is usually elliptical |