Gene Expression Data Analysis Suite (GEDAS)
Textual grids view
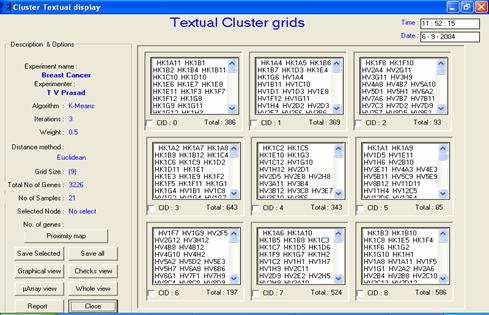
· Description or interpretation: The data output can be visualized in the form of clusters containing the actual gene names, as the idea has been picked up from most of the traditional text based ANN software available publicly. This output is the most primitive of all and could be confusing as long list of names are displayed for each cluster, as given in following figure. For larger datasets, this representation could be quite annoying. However, for detailed study of which genes have been clustered together, researchers may have to pin down to each gene name and function.
· Complexity: Similar to textual representation
· Special considerations/features: None
· Advantages and drawbacks: Though the output is impressive, it could be difficult to understand. This form of visualization does not give an idea of the overall gene expression.
· Applicability: It can be applied to all clustering/classification techniques including SOM, LVQ, k-means and SVM. Through GEDAS, this has also been extended to HC and PCA.
|
|
|
|
|
Figure: The textual view exhibits the
same clusters as that of temporal view; however, actual gene names are
displayed. In this example, a 3 x 3 SOM configuration output can be
seen |