Gene Expression Data Analysis Suite (GEDAS)
Whole sample/microarray view
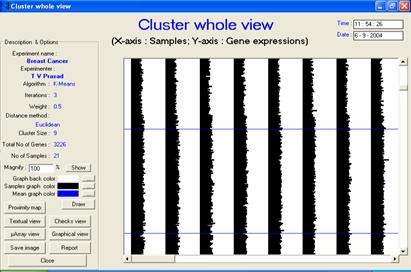
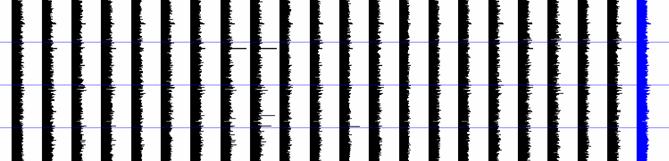
· Description or interpretation: The whole microarray view has its roots from bio-medical applications. All samples and genes can be visualized in such a form that dis (similarity) can be easily obtained. The last strip/band (default Colored in blue) is the median of all samples. This is a highly versatile representation of gene expression data with each band (or line graph) corresponding to each sample and the portion between two horizontal lines contains expression values of 100 genes.
· Complexity: This visualization has a complexity of O(n3)
· Special considerations/features: The last band is used to represent the median of all the samples. Facility is provided in GEDAS to change the background colour as well as the colour of the bands. The visualization can be enlarged or reduced according to the requirement, Figures 1 and 2.
· Advantages and drawbacks: While the behaviour of all individual samples can be visually matched with the neighbouring samples, this visualization requires more time for representing more samples (when zoomed out).
·
Applicability: It can be applied to raw data and pre-processed
data. Through GEDAS, this has been applied to SOM, LVQ, k-means, HC, SVM and PCA.
|
|
|
|
|
Figure 1: The whole (microarray or genome) view output is comparable to temporal view. The samples are always maintained, however, the arrangement of genes may alter after clustering. It is the best suited visualization for having visual inspection of gene expression |
|
|
|
|
|
|
|
Figure 2: The whole microarray view has its roots from bio-medical applications. All samples and genes can be visualized in such a form that dis(similarity) can be easily obtained. The last strip/band is the median of all samples. Some genes falling between 201 and 300 in samples 8 and 9 have very high gene expression; similarly in sample 11 between genes 301 and 400 |